

Mikro Executive Reports
Start the day with the numbers already on your screen.
 On the dashboard
- Live data from Mikro
- Dashboards on phone and tablet
- Automatic scheduled reports
- Threshold alerts
- Excel and PDF export
Who uses it
Owners who want the day’s figures before the first meeting.
Managers tracking receivables and cash position daily.
Managers following performance by product, region and rep.
Teams watching stock turnover and fulfilment performance.
What you see
Revenue and collections
Daily, weekly and monthly revenue against collections, with the gap between them made obvious.
Receivables ageing
Who owes what, and for how long, with overdue balances highlighted.
Stock and turnover
What is moving, what is sitting still, and where working capital is tied up.
Profitability
Margin by product group, customer and period, based on actual cost data.
Tip: Start with three or four numbers you check most often. Dashboards that try to show everything usually end up showing nothing.
Live in three steps
A read-only connection to your Mikro database is established.
Dashboards are configured around the questions you actually ask.
Figures are live, and scheduled reports and alerts go out automatically.
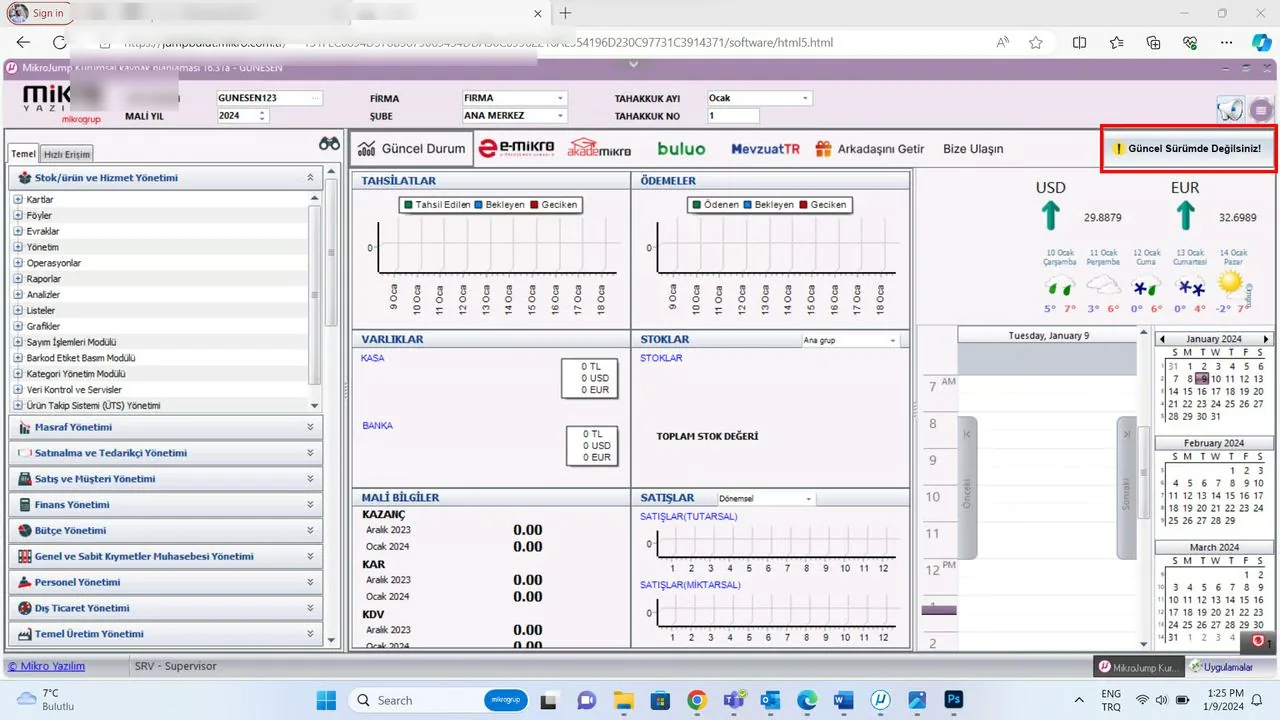
A view from the Mikro Jump application

Common questions
Where does the data come from?
Directly from your Mikro database, read-only. There is no second copy and no manual export step.
Can we see it on a phone?
Yes. Dashboards work fully in the browser on any phone or tablet, Android and iOS alike.
Can we design our own dashboards?
Yes. Dashboards are built from fields you choose, and our team helps with the more complex ones.
Will heavy reporting slow Mikro down?
Reports are built against summary structures, and heavy queries are scheduled outside working hours.
Keep exploring
Let us show you how Mikro Executive Reports works in your business
Let us walk through it together in a short demo — your data, your scenario, your questions answered live.